HowTo: Configure diginsight telemetry to the remote tools
Diginsight is a very thin layer built on .Net System.Diagnostics Activity API and ILogger API.
In particular, standard .Net System.Diagnostics activities and ILogger telemetry are sent to remote tools by means of OpenTelemetry and/or Prometheus.
This enables in sending the full diginsight application flow to the remote tools.
This article discusses how we can configure Diginsight telemetry to remote tools such as Azure Monitor or Grafana.
Also, the article shows how such telemetry can be easily analyzed on Azure Monitor tools such as the Transaction Search and Transaction Detail, the Azure Monitor Metrics, Logs or Azure Monitor Dashboards.
The code snippets below are available as working samples within the telemetry.samples repository.
Article HOWTO - Use Diginsight Samples.md: explores how we can use diginsight samples to test and understand integration of Diginsight telemetry in our own projects.
STEP 01 - Add a package reference to the packages Diginsight.Diagnostics.AspNetCore.OpenTelemetry
In the first step you can just add a diginsight references to your code: 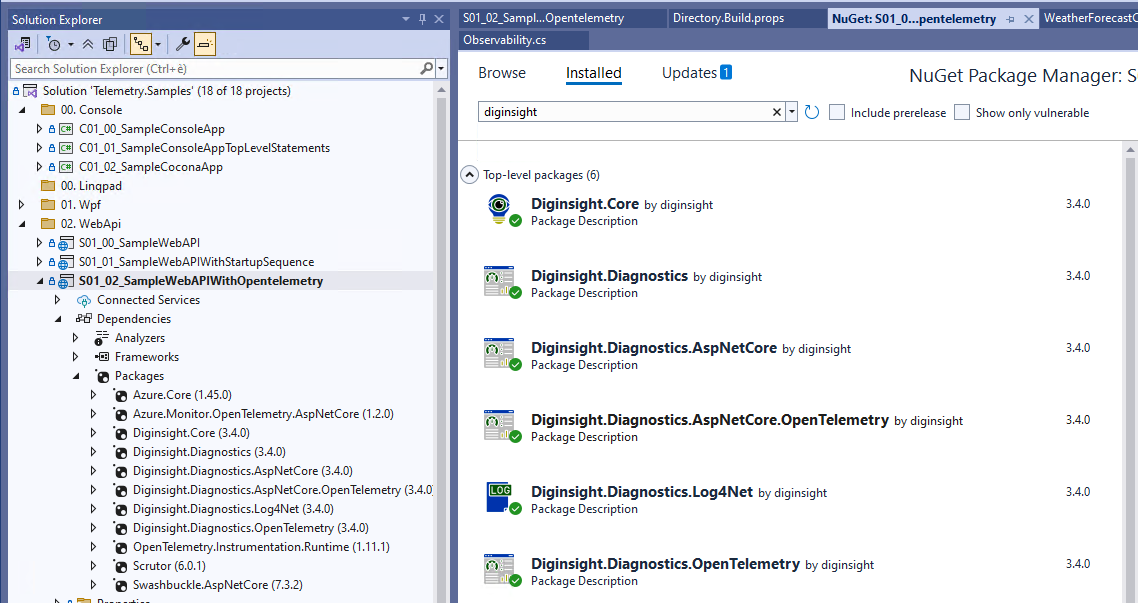
STEP 02 - Configure telemetry on the Startup sequence
The S01_02_SampleWebAPIWithOpentelemetry sample shows an example WebApi fully integrated with OpenTelemetry and AzureMonitor.
The Program.Main entry point activates telemetry by means of AddObservability() .UseDiginsightServiceProvider() as shown below.
The startup sequence is identical to the one seen for the local Console and Log4Net providers.
The difference lies in AddObservability() that, in addition to Console and Log4Net providers, enables OpenTelemetry for AzureMonitor.
public static void Main(string[] args)
{
    // this enables sending telemetry for the startup sequence
    // telemetry is recorded until ServiceProvider creation
    // after that, recorded telemetry is sent to the configured registered providers
    // (eg. AzureMonitor, Console, Log4Net)
    using var observabilityManager = new ObservabilityManager();
    ILogger logger = observabilityManager.LoggerFactory.CreateLogger(typeof(Program));
    Observability.LoggerFactory = observabilityManager.LoggerFactory;

    WebApplication app;
    using (var activity = Observability.ActivitySource.StartMethodActivity(logger, new { args }))
    {
        var builder = WebApplication.CreateBuilder(args);
        var services = builder.Services;
        var configuration = builder.Configuration;
        var environment = builder.Environment;

        // Add logging and opentelemetry providers
        services.AddObservability(configuration, environment, out IOpenTelemetryOptions openTelemetryOptions);

        // registers recorded telemetry for flush after ServiceProvider creation
        observabilityManager.AttachTo(services);
        services.TryAddSingleton<IActivityLoggingSampler, NameBasedActivityLoggingSampler>();

        services.AddControllers();
        services.AddEndpointsApiExplorer();
        services.AddSwaggerGen();

        // use diginsight service provider
        // this enables telemetry initialization at service provider creation
        builder.Host.UseDiginsightServiceProvider(true);
        app = builder.Build();

        if (app.Environment.IsDevelopment())
        {
            app.UseSwagger();
            app.UseSwaggerUI();
        }

        app.UseHttpsRedirection();

        app.UseAuthorization();

        app.MapControllers();
    }

    app.Run();
}
in the code above: - AddObservability() configures log for the application Console, log4net file log and also for Opentelemetry. - UseDiginsightServiceProvider() is used to activate diginsight during the service provider build() process.
Please note that AddObservability() is implemented as an extension method that calls AddLogging() with: - AddDiginsightConsole(): this methods configures the Console log provider with some formatting options 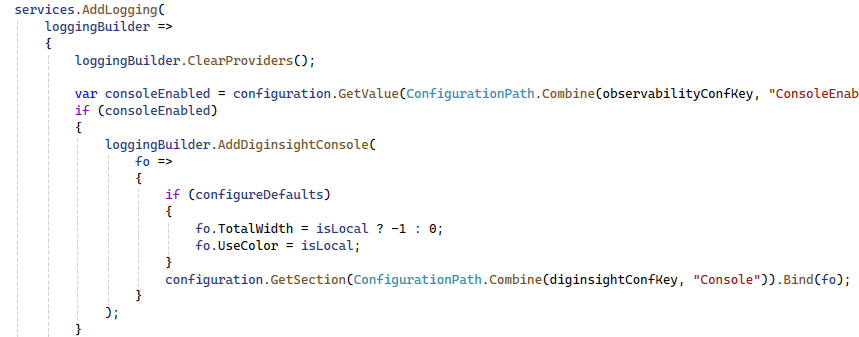
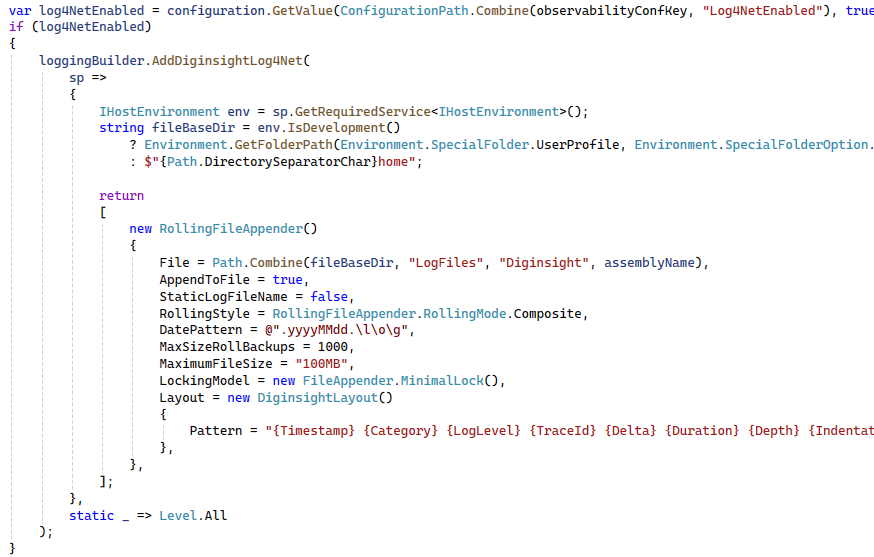
- AddDiginsightLog4Net(): this methods configures a rolling File log on the user profile folder.
- services.Configure
(openTelemetryConfiguration) and
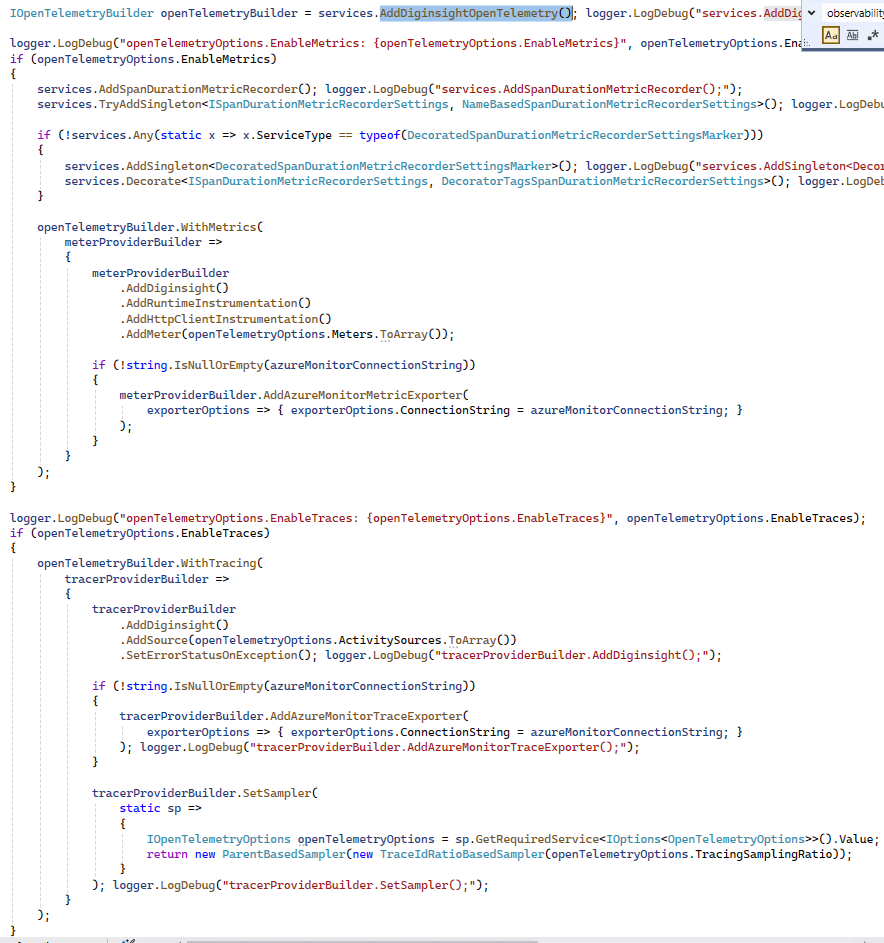
AddDiginsightOpenTelemetry(): this methods configures the OpenTelemetry provider with the AzureMonitor connection string.
In caseEnableMetricsis set to true,openTelemetryBuilder.WithMetricsis called to send predefined metrics such as the span_duration metric for configured methods.
In caseEnableTracesis set to true,openTelemetryBuilder.WithTracingis called to include ILogger traces into the opentelemetry flow sent to the remote tools.
Configuration Structure
Diginsight configuration is organized in two main sections:
1. Diginsight:Activities Configuration
Controls activity sources, logging behavior, and metric recording:
{
  "Diginsight": {
    "Activities": {
      // Activity source filtering - which sources to listen to
      "ActivitySources": {
        "MyApp.*": true,
        "Azure.Cosmos.Operation": true,
        "Azure.Storage.Blobs.BlobBaseClient": true,
        "Microsoft.AspNetCore": true,
        "Microsoft.EntityFrameworkCore": false,
        "System.*": false
      },

      // Logging behavior control
      "LogBehavior": "Hide",              // Default: Hide, Show, or Truncate
      "ActivityLogLevel": "Debug",        // Log level for activity events (default: Debug)
      "WriteActivityActionAsPrefix": false,
      "DisablePayloadRendering": false,

      // Activity-specific logging control (pattern-based)
      "LoggedActivityNames": "MyApp.Orders.* MyApp.Payment.*=Show MyApp.Internal.*=Hide",

      // Metric recording configuration
      "RecordSpanDuration": true,         // Master switch for span duration metrics
      "SpanDurationMeterName": "Diginsight.Diagnostics",
      "SpanDurationMetricName": "diginsight.span_duration",
      "SpanDurationMetricDescription": "Duration of application spans in milliseconds"
    }
  }
}
Key properties: - ActivitySources: Pattern-based dictionary controlling which activity sources are monitored - Use wildcards (*) for flexible matching - true = monitor, false = ignore
LogBehavior: Global default for activity logging behavior (default:Hide)Show: Log activity start/end eventsHide: Don’t log activity events (activities still created for tracing)Truncate: Log start but skip end events
ActivityLogLevel: Log level for activity lifecycle events (default:Debug)- Standard .NET log levels:
Trace,Debug,Information,Warning,Error,Critical - Note: When accessed via
IDiginsightActivitiesLogOptionsinterface, exposed asLogLevel
- Standard .NET log levels:
LoggedActivityNames: Fine-grained control over specific activities- Space-separated patterns:
"Pattern1 Pattern2=Show Pattern3=Hide" - Overrides global
LogBehavior - When accessed via
IDiginsightActivitiesLogOptionsinterface, exposed asActivityNames
- Space-separated patterns:
RecordSpanDuration: Controls automatic span duration metric recording (default:false)- When
true, recordsdiginsight.span_durationmetric for all activities - Can be overridden per class using class-aware configuration
- When
- Metric naming properties:
SpanDurationMeterName: OpenTelemetry meter nameSpanDurationMetricName: Metric name in telemetry system (default: “diginsight.span_duration”)SpanDurationMetricDescription: Human-readable description
- Other properties:
WriteActivityActionAsPrefix: Include action (START/END) as prefix in logs (default:false)DisablePayloadRendering: Disable rendering of activity payloads (default:false)